

Documentation Index
Fetch the complete documentation index at: https://docs.antryk.com/llms.txt
Use this file to discover all available pages before exploring further.
What are Web Services?
Web Services are containerized backend applications that run continuously and automatically scale based on traffic. They provide persistent HTTP endpoints for your APIs and applications.Key Features
- Autoscaling: Automatically scale up or down based on traffic
- Load Balancing: Distribute traffic across multiple instances
- Zero Downtime Deployments: Deploy updates without service interruption
- Health Checks: Automatic health monitoring and recovery
- Custom Domains: Use your own domain with automatic SSL certificates
- Environment Variables: Secure configuration management
- Logs & Metrics: Real-time observability
Use Cases
- REST APIs and GraphQL endpoints
- Microservices architecture
- Webhooks and background processing
- Long-running backend services
- Database connections and connections pooling
Quickstart: Deploy an Express App
Guide on deploying web service
Deploy a Node.js Express application on Antryk in just a few clicks. This quickstart uses a simple example app, but you can use your own Express app instead.
Step 1: Fork the Repository
Fork theexpress-hello-world repository on GitHub.
Example Express App Structure
The example repository contains a simple Express app:Step 2: Create a Web Service
In the Antryk Dashboard,Go To Sidebar → click Web Service → click on Deploy Service.Step 3: Configure Your Service
Provide the following values during creation:Service Name
- Give your web-service a professional name.
Deploy from Git Providers
- Git Provider - Select your git provider.
- Repository: Select your GitHub repository
- Branch: Choose the branch to deploy from (e.g.,
main) - Framework: Automatically detected from your repository
- Install Command:
npm installoryarn install - Build Command:
npm run build(if needed) or leave empty - Start Command:
node app.jsornpm start - Output Directory: Leave empty for Express apps
- Version: Automatically detected Node.js version from main. (e.g.,
18or20)
Region
Select your deployment region:- USA
- Europe
- Asia
Environment Variables
Add any environment variables your app needs (API keys, database URLs, etc.).- Click + Add Environment Variable to add individual variables
- Click Add from .env to import from a
.envfile - Variables marked as Secret will be hidden in logs
Configuration Summary
For the Express hello world app, your configuration should look like this:| Setting | Value |
|---|---|
| Repository | your-username/express-hello-world |
| Branch | main |
| Framework | Node.js (auto-detected) |
| Install Command | npm install |
| Build Command | (leave empty) |
| Start Command | node app.js |
| Output Directory | (leave empty) |
| Version | 18 |
| Region | us-east-1 |
Step 4: Deploy
Click Deploy and your web service will be live at itsantryk.app URL as soon as the deploy finishes.
Going forward, every push to your linked branch automatically builds and
deploys your app. If a build fails, Antryk cancels the deploy, and your app’s
existing version continues running until the next successful deploy.
Step 5: Monitor Your Deployment
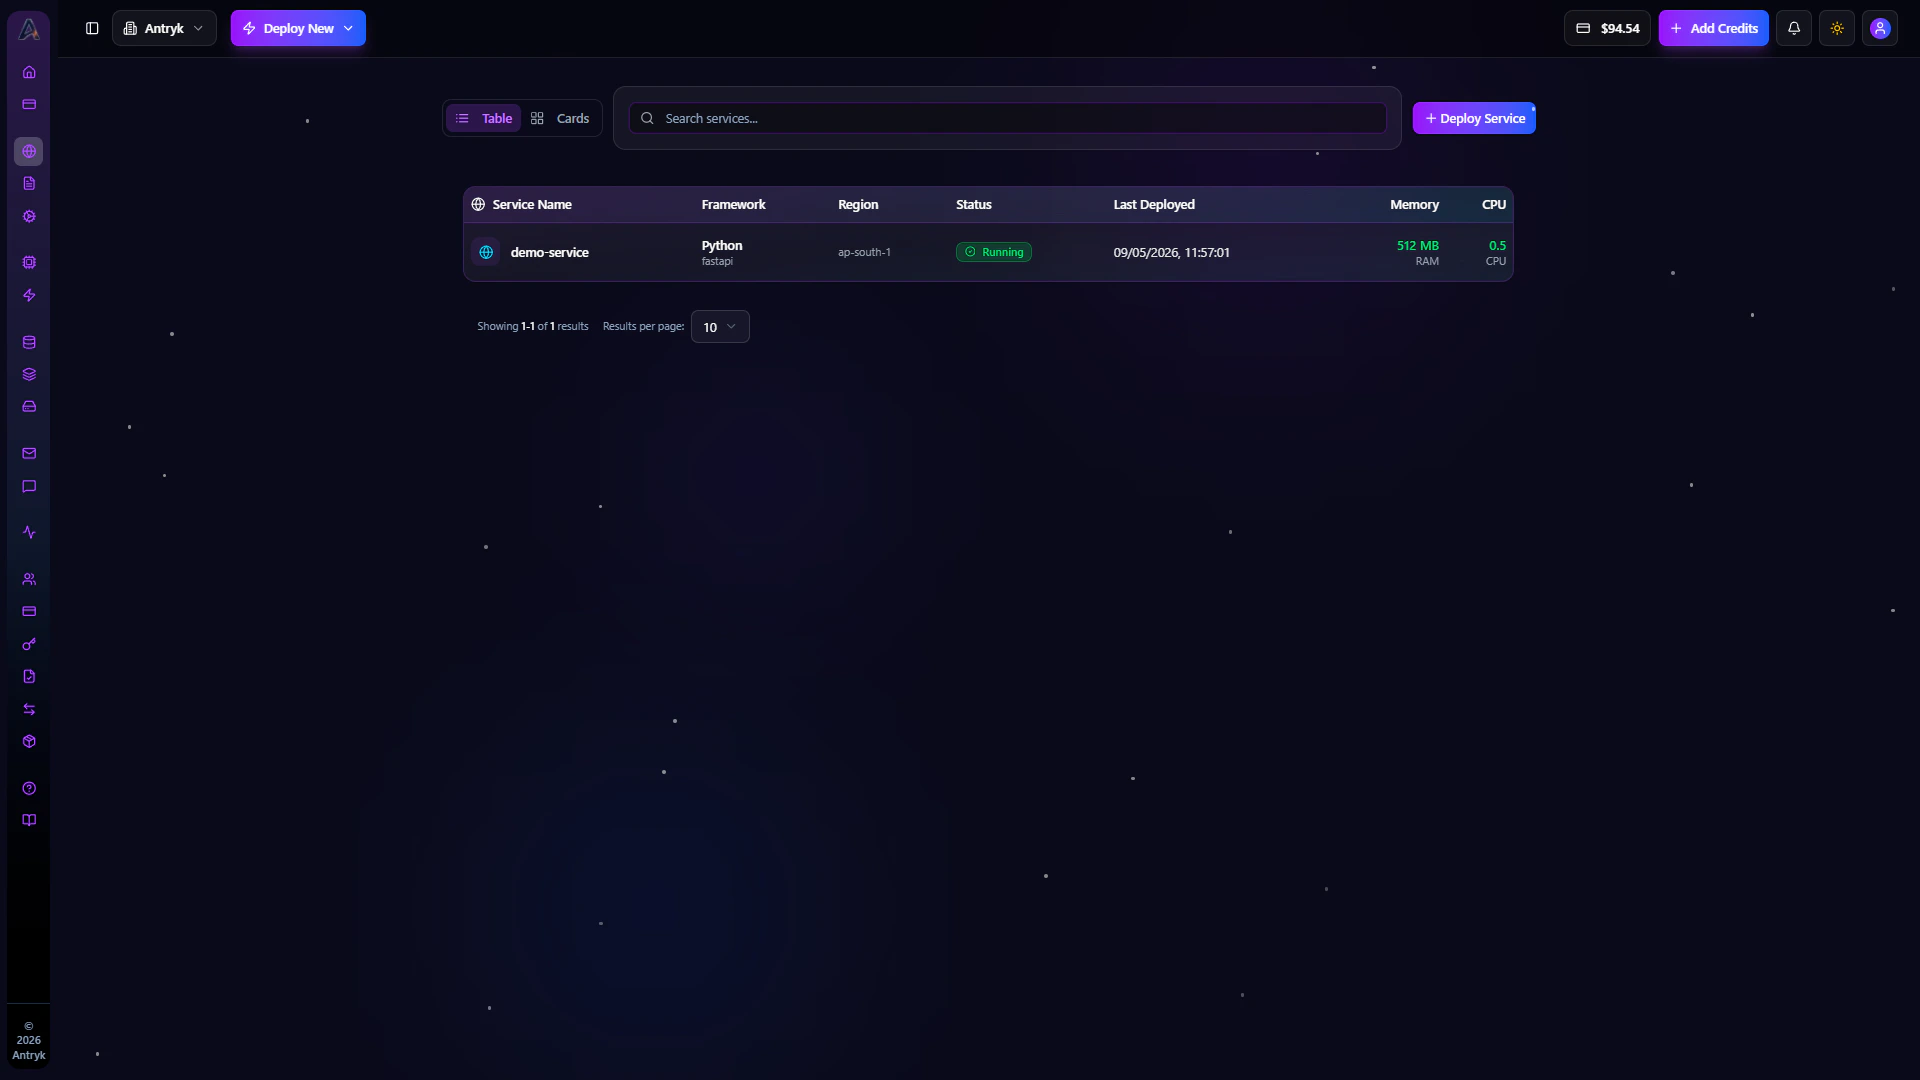
Once deployed, you can:- View Logs: Real-time logs from your application
- Check Metrics: CPU, memory, and request metrics
- View Deployments: History of all deployments
- Manage Scaling: Add or remove instances
- Update Config: Modify environment variables and settings
Troubleshooting Express Apps
App won’t start:- Check the Start Command matches your
package.jsonscripts - Ensure your app listens on
0.0.0.0and usesprocess.env.PORT - Review build logs for errors
- Verify variables are set in the console
- Restart the service after adding variables
- Check variable names match your code
- Check Node.js version compatibility
- Review
package.jsondependencies - Ensure build commands are correct
- Verify database credentials in environment variables
- Check database is accessible from service IP
- Review connection pooling settings
Getting Started
- Create a new Web Service from your dashboard
- Connect your repository or use Docker images
- Configure resources (CPU, memory, instances)
- Set environment variables and secrets
- Deploy and get your service URL
Console Configuration
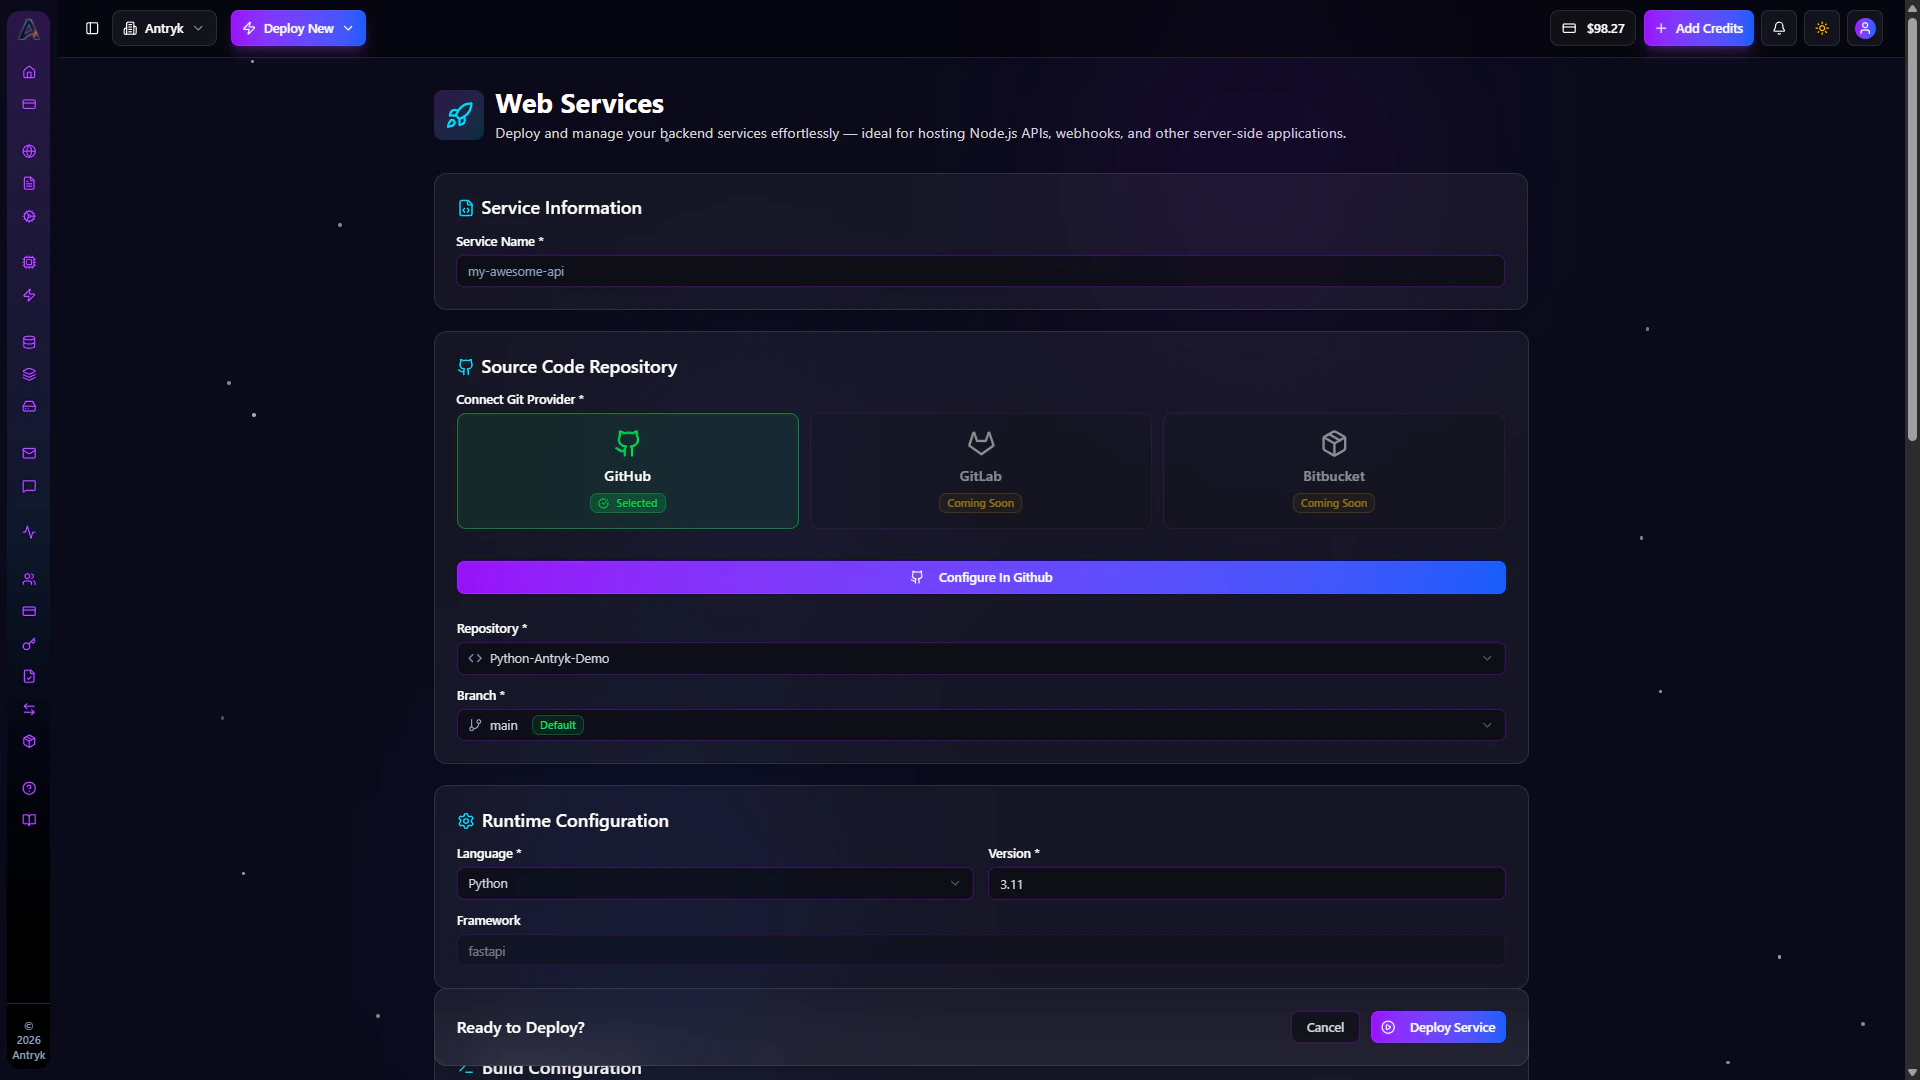
When creating a Web Service in the Antryk console, you’ll configure these settings:Deploy from GitHub
- Repository: Select the GitHub repository you want to deploy
- Branch: Choose the branch to deploy from (e.g.,
main,develop) - Framework: Automatically detected from your repository
- Install Command: Command to install dependencies (e.g.,
npm install,yarn install,pip install -r requirements.txt) - Build Command: Command to build your project (e.g.,
npm run build,yarn build) - Start Command: Command to start your app (e.g.,
npm start,node app.js,python app.py) - Output Directory: Where your built files are stored (leave empty for Express APIs)
- Version: Runtime version (e.g., Node.js
18, Python3.11)
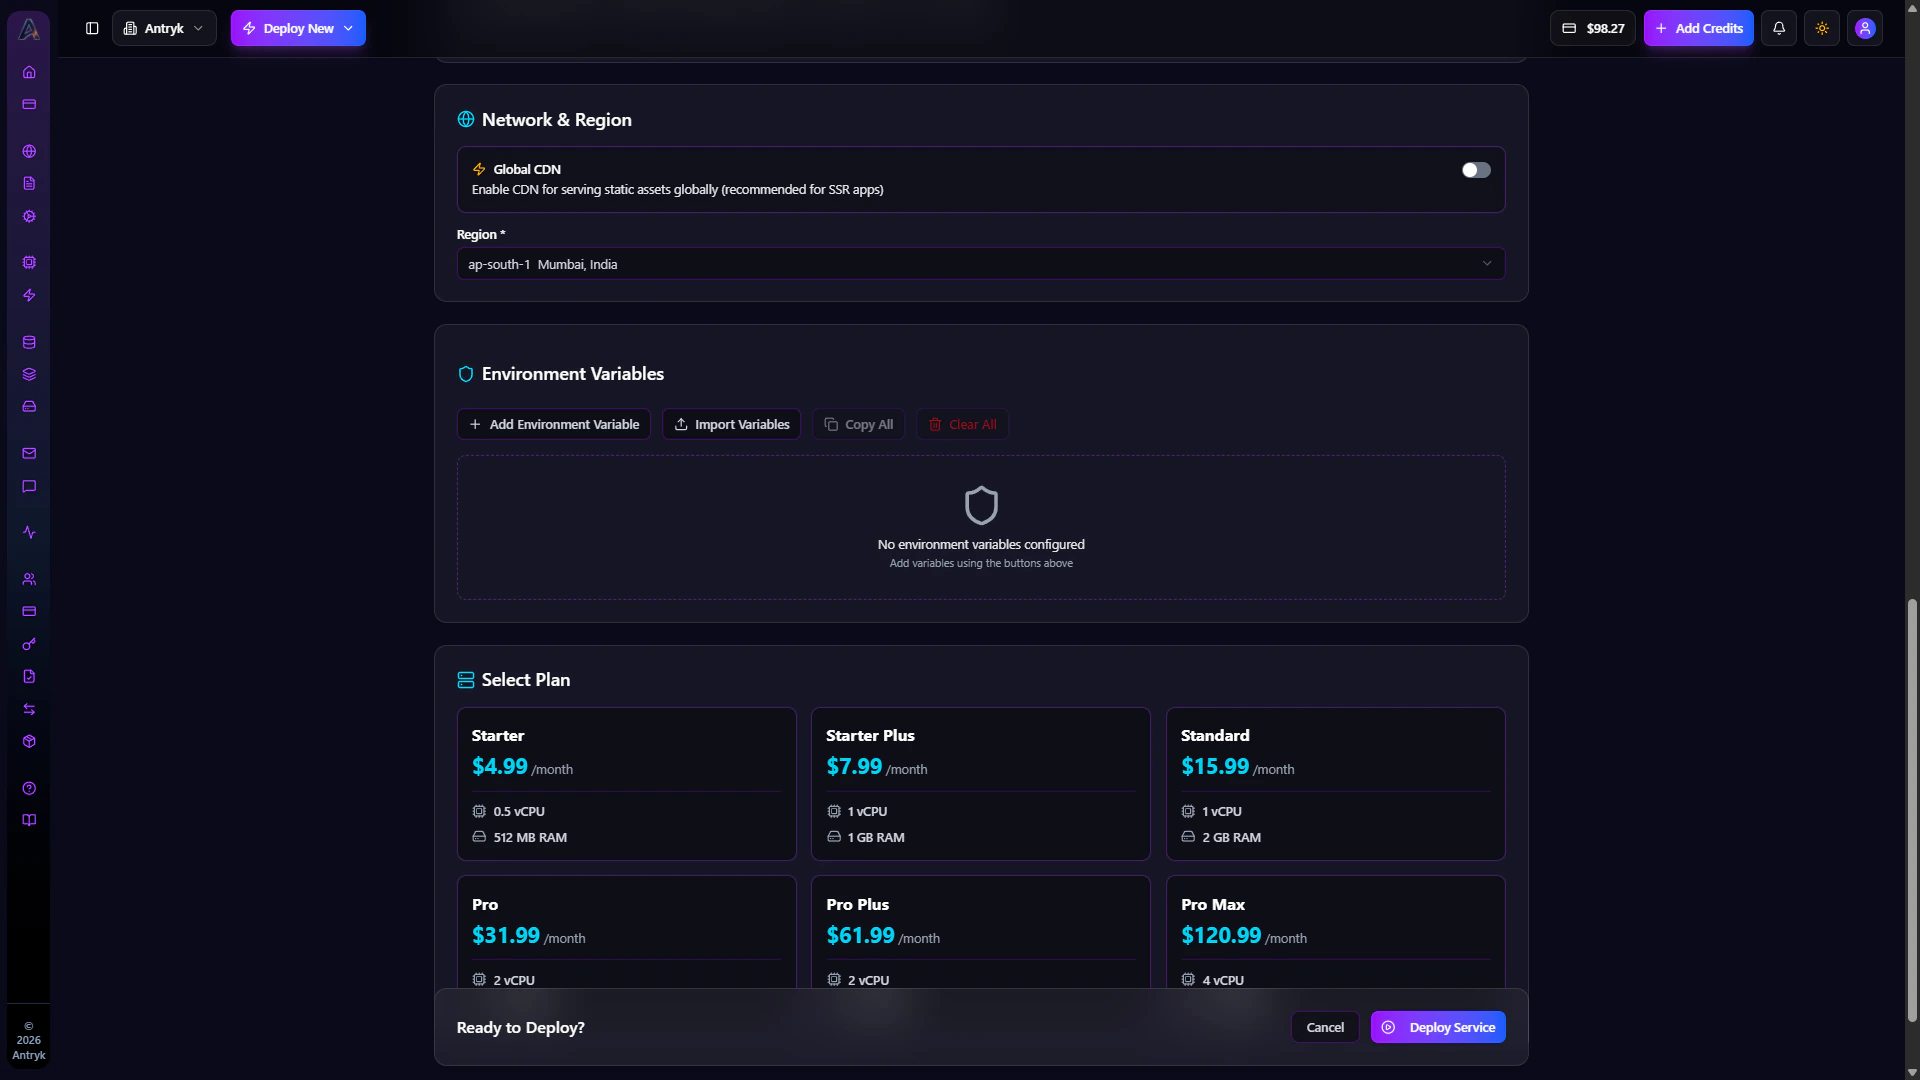
Region
Pick a region — resources will be provisioned here:us-east-1- Virginia, USAus-west-2- Oregon, USAeu-west-1- Irelandeu-central-1- Frankfurt, Germanyap-south-1- Mumbai, Indiaap-southeast-1- Singaporeap-northeast-1- Tokyo, Japan
Environment Variables
Set environment-specific config and secrets (API keys, tokens, etc.). These values will be available to your app at runtime.- Add individual variables or import from
.envfile - Mark variables as secret to hide them in logs
- Use different values for different environments
Configuration Examples
Node.js/Express
Python/Flask
Python/FastAPI
Go
Ruby/Rails
Advanced Configuration
Web Services support additional configuration through:- Docker: Use custom Docker images
- Autoscaling: Set min/max instances based on CPU or memory
- Health Checks: Configure custom health check endpoints
- Resources: Adjust CPU and memory allocation
- Instance Type: Choose between standard and performance instances
Pricing
Web Services are billed by:- Instance hours: Running time of your service
- Resource usage: CPU and memory allocation
- Bandwidth: Inbound and outbound data transfer
Web Service Detail Insights
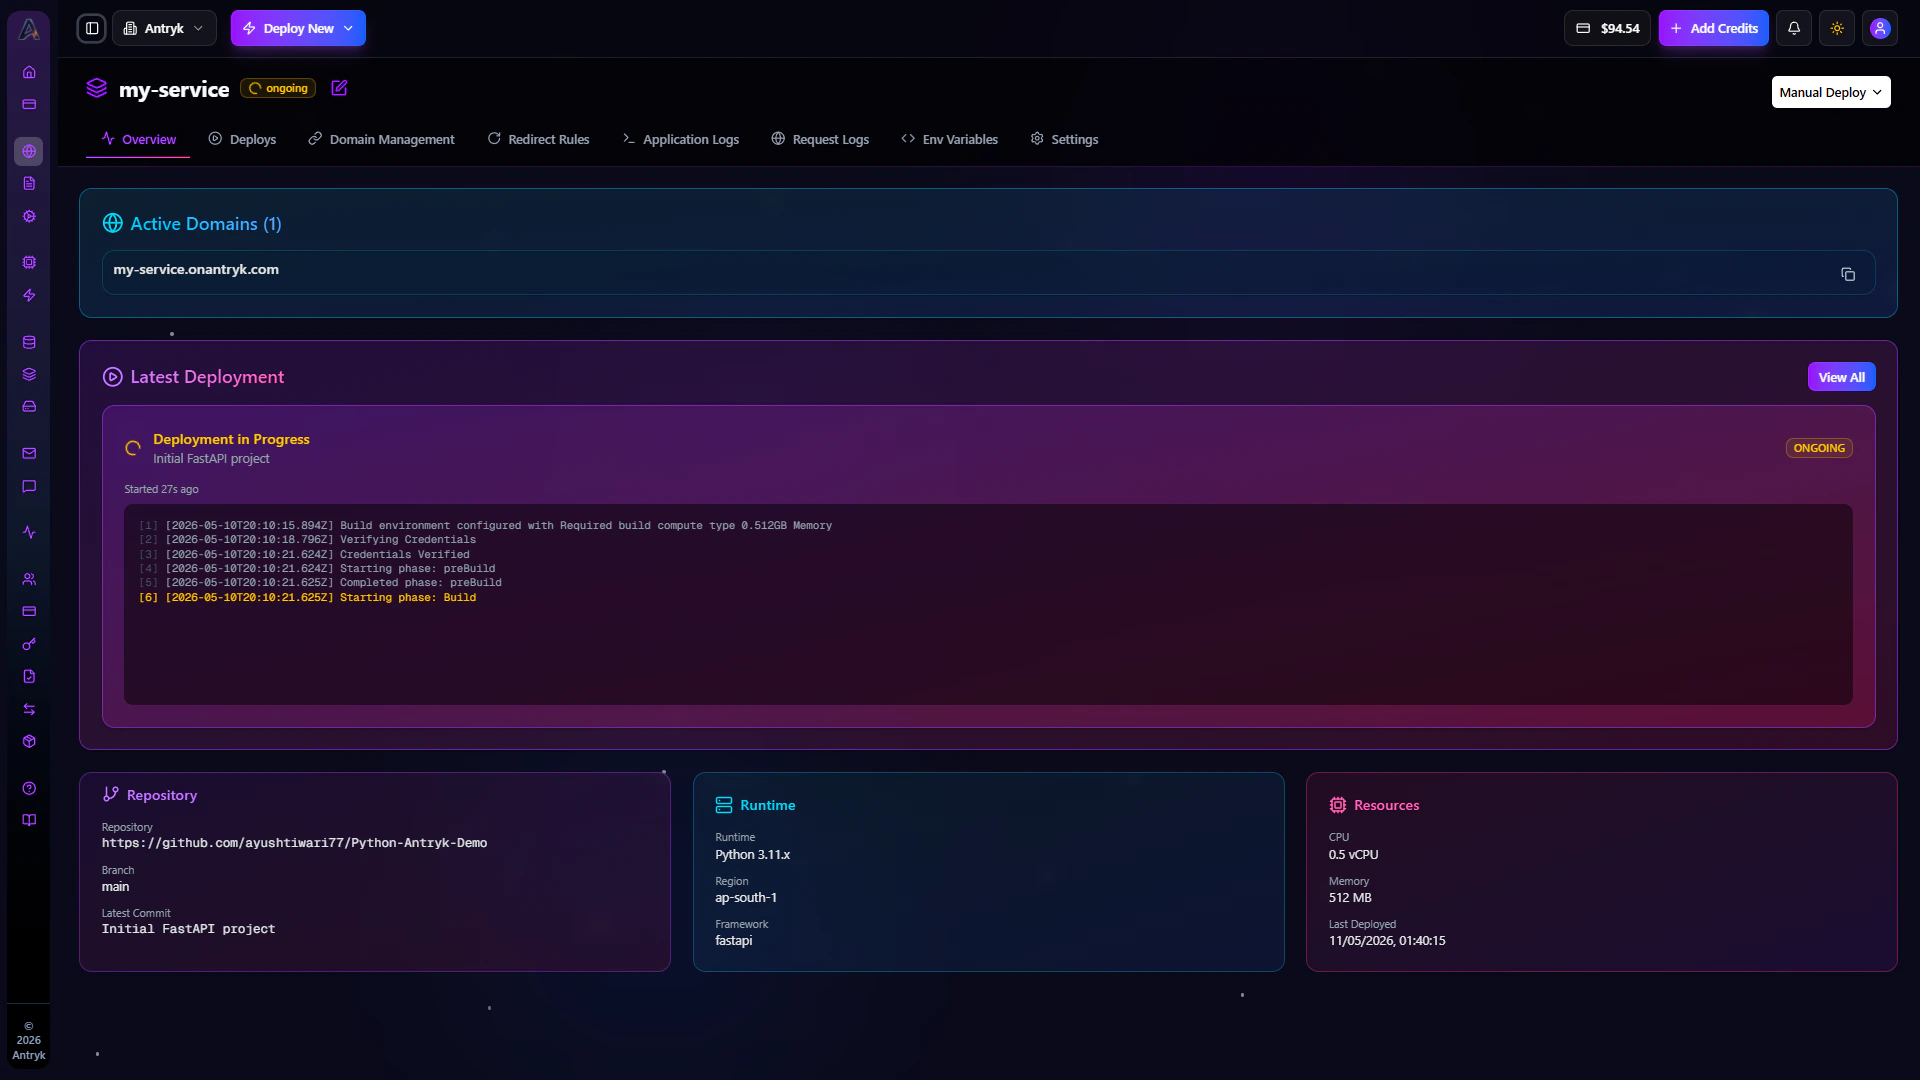
Click any Web Service from the dashboard to open the detailed service management page. This interface gives you complete visibility into deployments, domains, logs, environment configuration, and operational settings for your application. The Web Service detail page is designed to help developers monitor application health, troubleshoot issues, manage infrastructure, and safely deploy updates from a single control panel.Overview
The Overview tab provides a high-level summary of your deployed application and infrastructure configuration. It helps you quickly understand the current state of your service without navigating across multiple sections. From this page, you can monitor deployment activity, runtime configuration, repository details, infrastructure resources, and production domains associated with your application.Available Information
- Active production domains
- Latest deployment status and deployment history preview
- Connected Git repository and deployment branch
- Latest commit message and deployment author
- Runtime and framework information
- Deployment region and infrastructure location
- CPU and memory allocation
- Last deployed timestamp
Operational Benefits
The Overview section helps teams:- Verify production deployment status
- Identify the currently deployed version
- Audit deployment metadata
- Confirm infrastructure configuration
- Quickly access deployment and repository information
Example Use Cases
- Validate that the latest deployment succeeded
- Confirm the correct Git branch is connected
- Check allocated compute resources
- Review recent deployment activity during incidents
- Verify runtime versions like Node.js or Python
Deploys
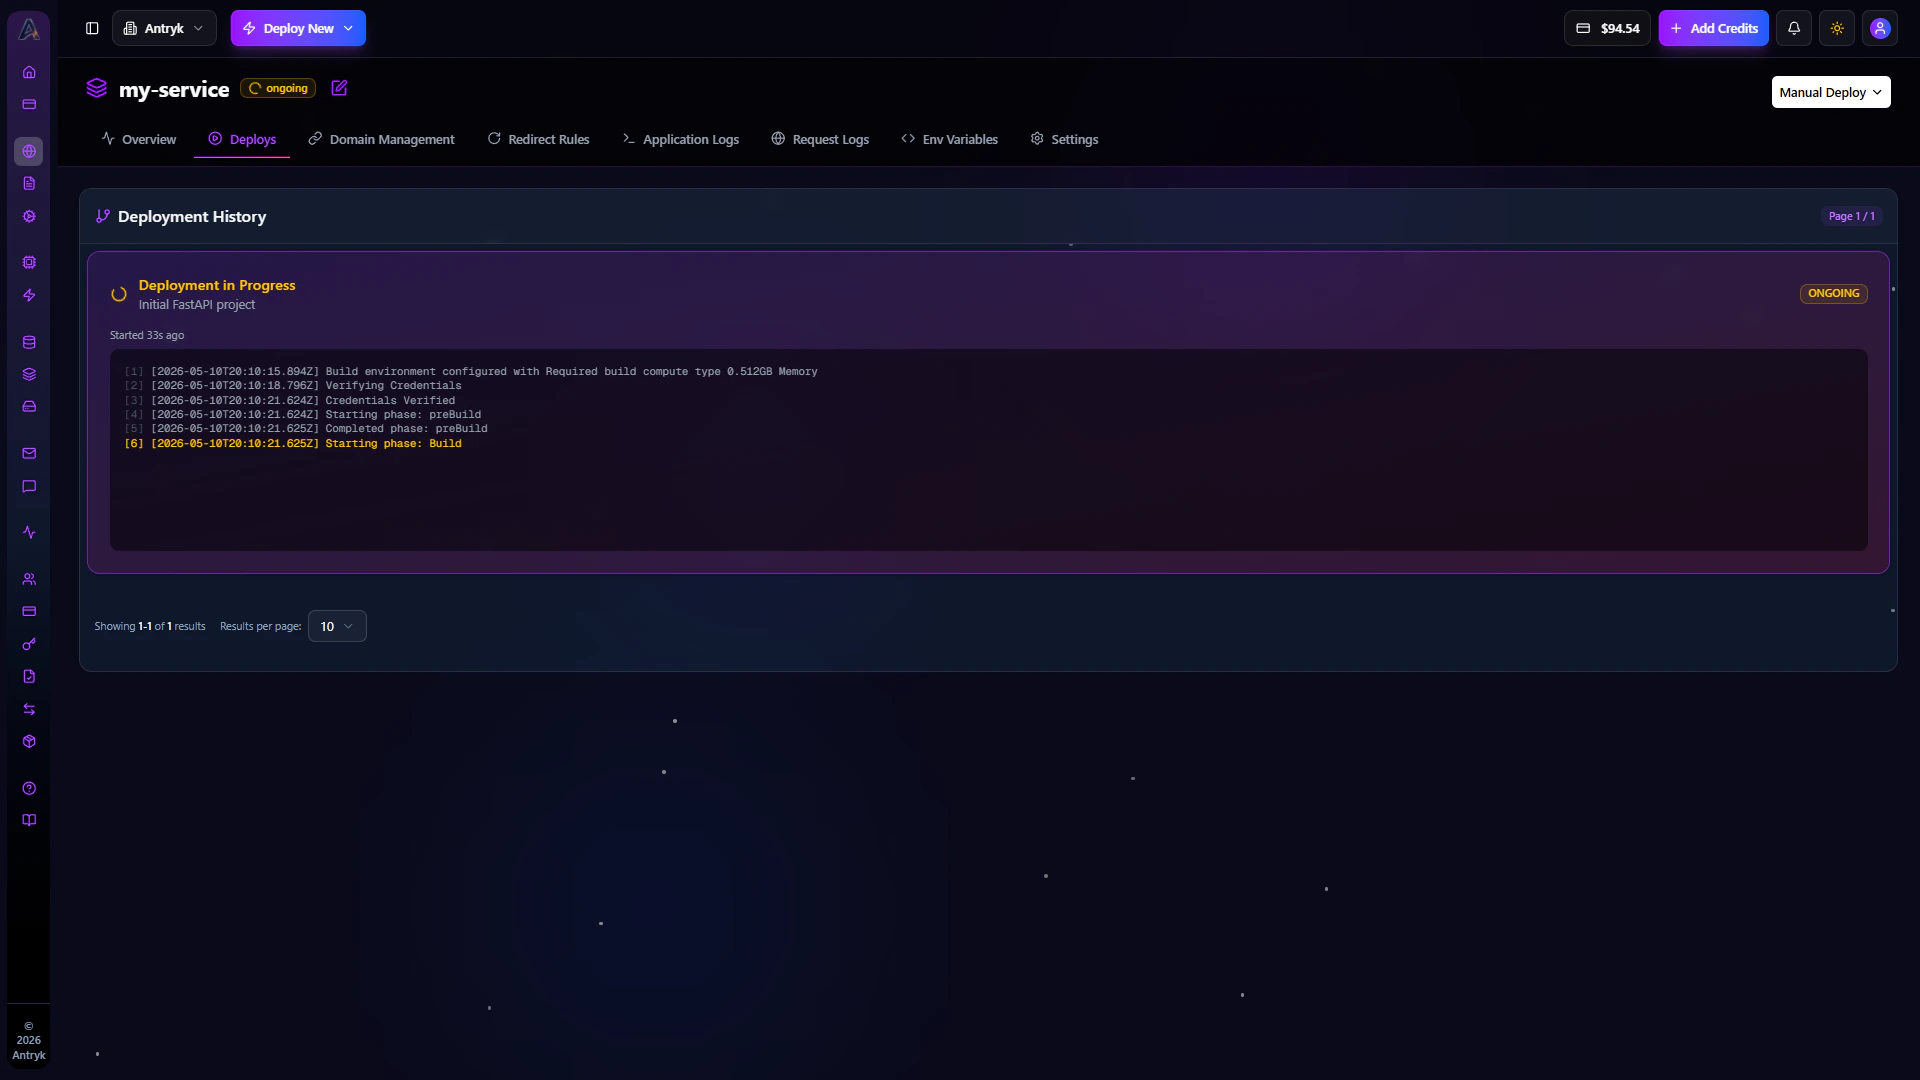
The Deploys tab contains the complete deployment history for your Web Service. Every deployment triggered from Git pushes, manual redeployments, or configuration updates is recorded here. This section provides visibility into deployment timelines, build status, deployment logs, and rollback references.Deployment History Features
- View all historical deployments
- Inspect deployment status and duration
- Access build and runtime logs
- Review commit messages and authors
- Identify failed deployments quickly
- Redeploy previous stable versions
Deployment Monitoring
Each deployment includes:- Deployment ID
- Git commit reference
- Branch information
- Build duration
- Deployment status
- Trigger source
- Deployment timestamp
Benefits
The Deploys section helps developers:- Debug failed deployments
- Audit release history
- Track production changes
- Roll back problematic releases
- Monitor CI/CD workflow execution
Domain Management
Manage Your domains with domain management
Get started with Domains.
Redirect Urls
Manage Your redirects with redirect URL mangement
Get Started with Redirects.
Application Logs
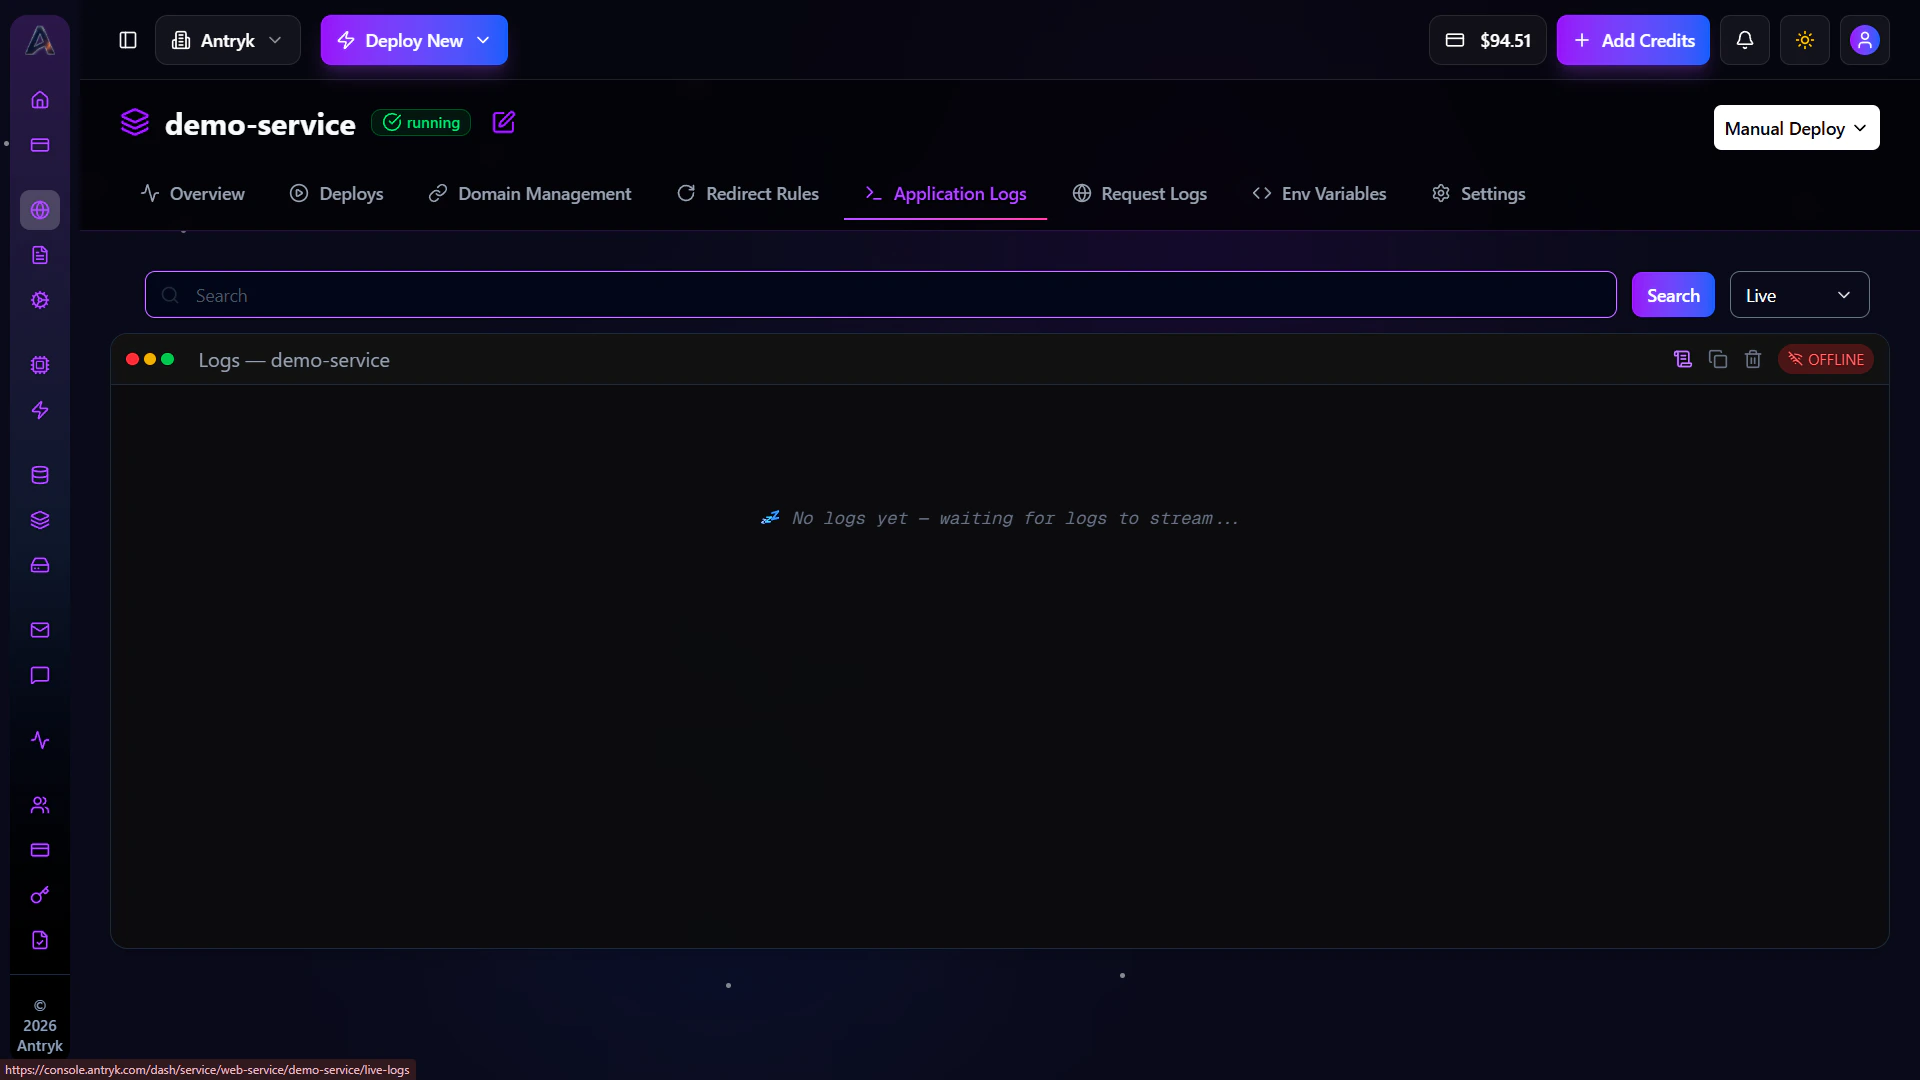
The Application Logs tab provides real-time logging and observability for your running application instances. Logs help developers monitor runtime behavior, debug issues, and troubleshoot production incidents efficiently. This section streams logs directly from your application containers and services.Logging Capabilities
- Real-time live log streaming
- Search and filter logs instantly
- Custom time range selection
- Predefined ranges like:
- Live logs
- Last 1 hour
- Last 6 hours
- Last 24 hours
- Structured log inspection
- Error tracking and debugging
Common Use Cases
- Debug startup failures
- Investigate runtime exceptions
- Monitor API activity
- Validate environment configuration
- Analyze production incidents
- Track background job execution
Search & Filtering
Use search filters to quickly find:- Error messages
- API routes
- User activity
- Deployment events
- Warning and debug logs
Request Logs
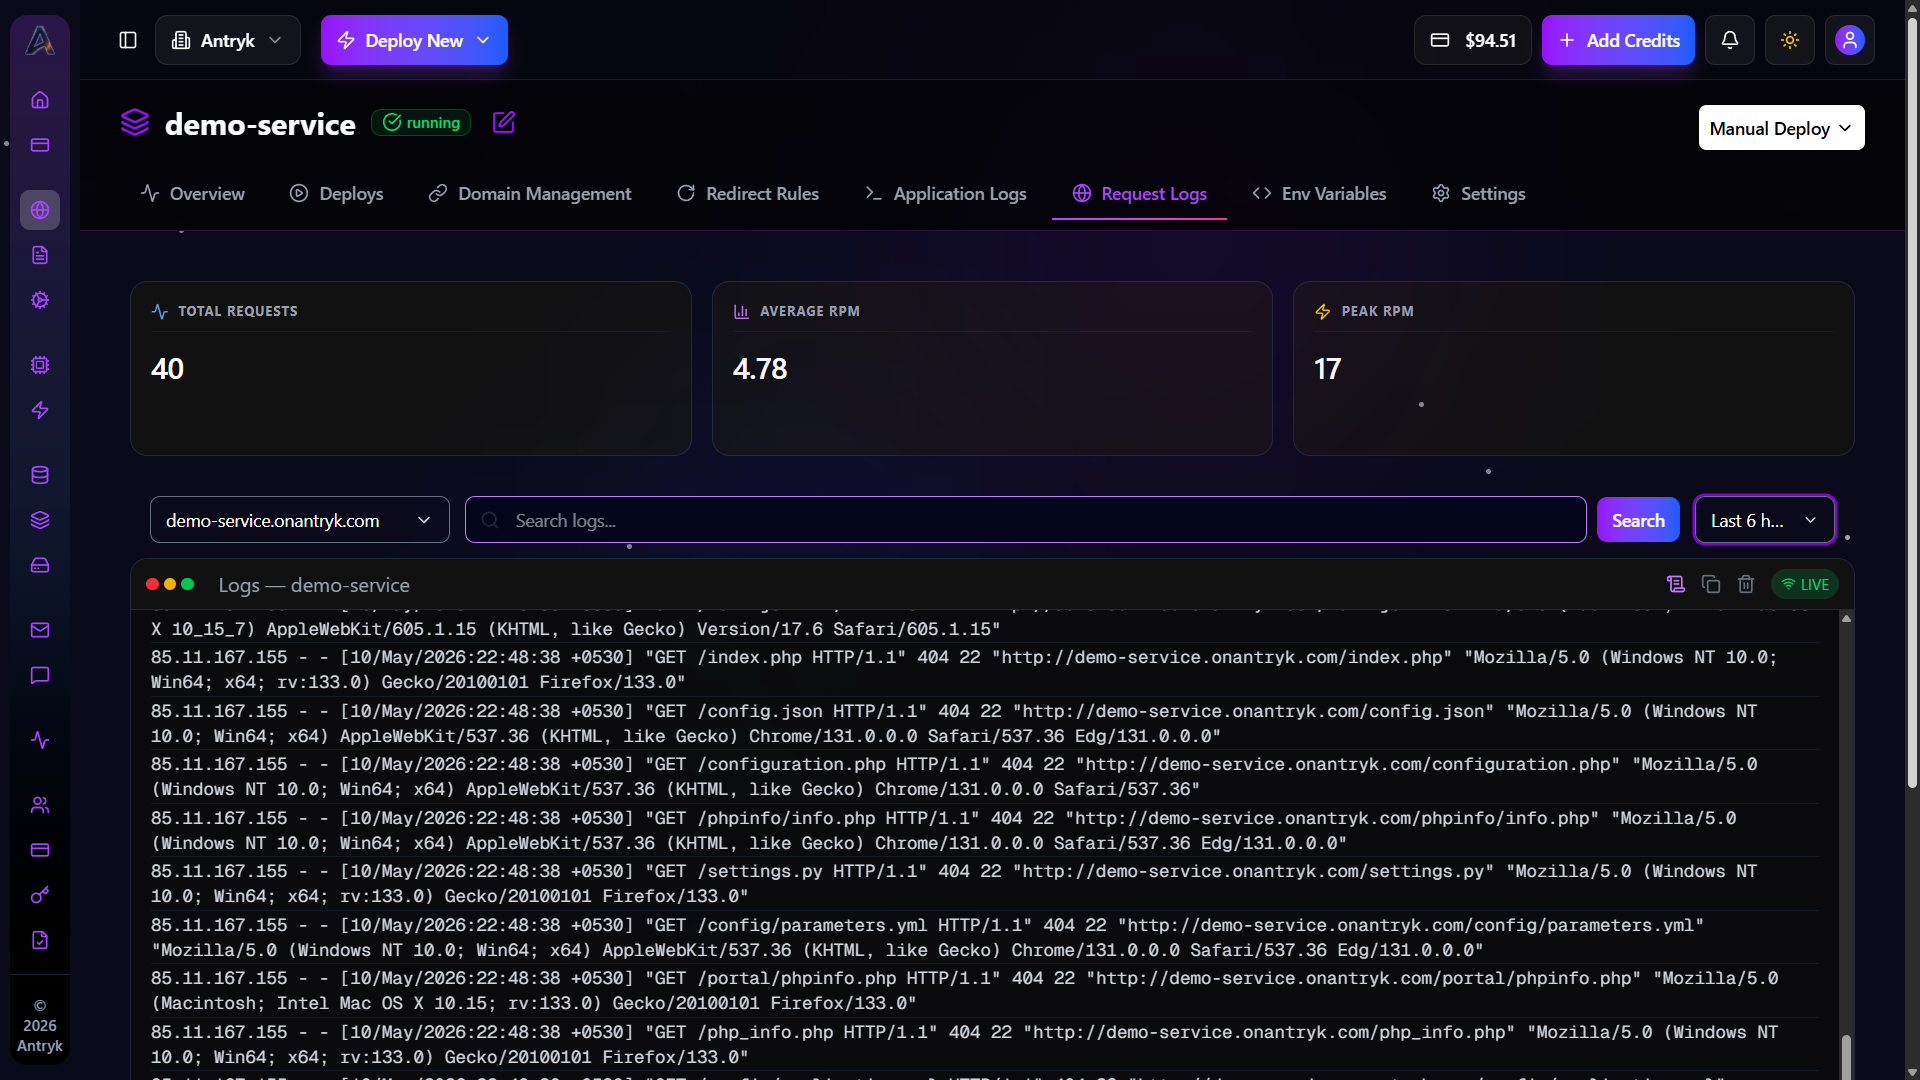
The Request Logs tab provides detailed visibility into incoming HTTP traffic handled by your Web Service. It helps teams monitor request behavior, response performance, traffic spikes, and API usage patterns. Unlike Application Logs, Request Logs focus specifically on network-level request and response information.Request Monitoring Features
- View incoming HTTP requests in real time
- Analyze response status codes
- Inspect request methods and endpoints
- Monitor latency and response times
- Search requests using filters
- Filter by custom time ranges
Available Time Filters
- Live requests
- Last 1 hour
- Last 6 hours
- Last 24 hours
Request Insights
Track important metrics such as:- Request volume
- Error rates
- Slow endpoints
- Traffic spikes
- API usage trends
- Response duration
Benefits
Request Logs help developers:- Debug API failures
- Monitor production traffic
- Identify slow endpoints
- Investigate client-side issues
- Analyze request patterns
- Improve API performance
Env
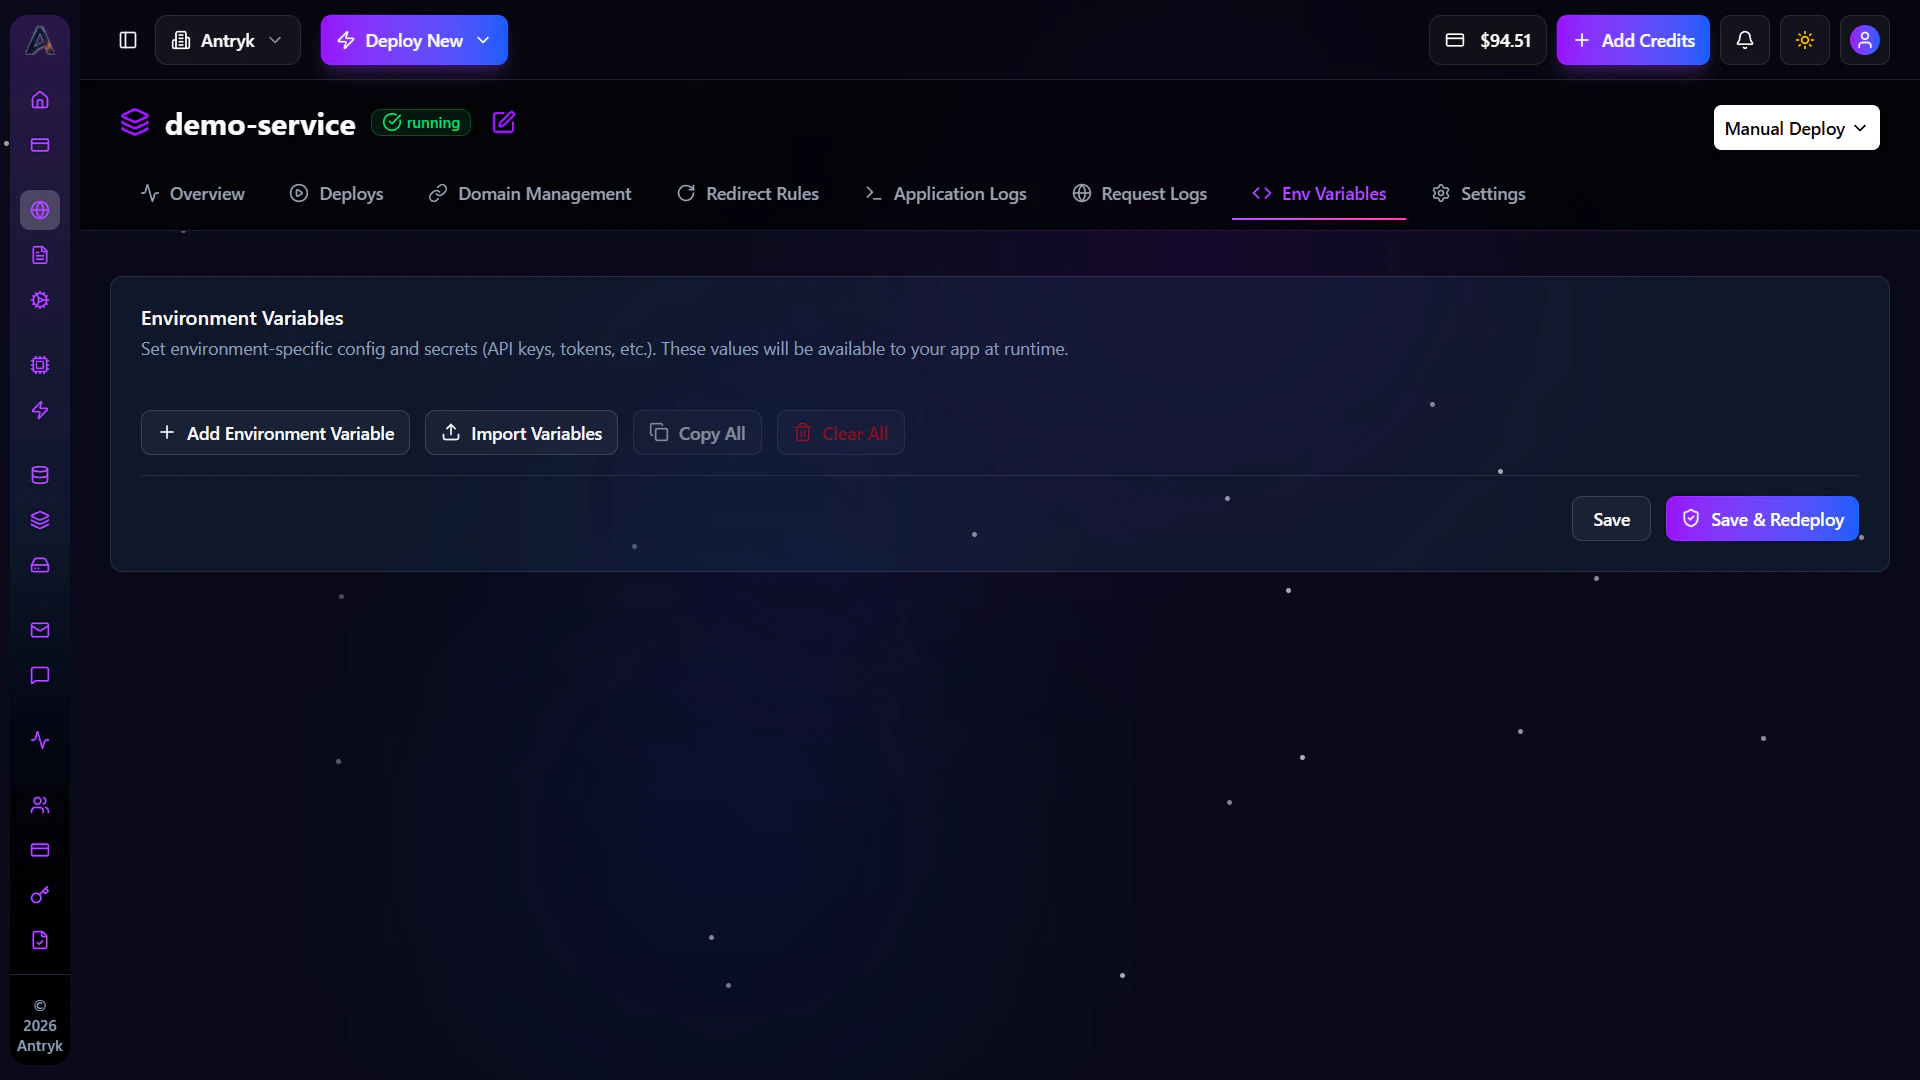
The Env tab allows you to securely manage environment variables and runtime configuration for your Web Service. Environment variables help store secrets, API keys, database credentials, and environment-specific application settings. Changes made here can optionally trigger a redeployment to apply updated configuration immediately.Environment Variable Management
- Create environment variables
- Edit existing variables
- Delete unused variables
- View runtime configuration
- Store sensitive secrets securely
- Save configuration changes instantly
Available Actions
- Save changes without redeploying
- Save and redeploy service
- Update secret values
- Manage production configuration
- Import
.envfiles
Common Environment Variables
Examples include:- Database URLs
- API tokens
- JWT secrets
- Third-party credentials
- Runtime environment values
Security Benefits
Environment variables improve security by:- Keeping secrets outside source code
- Preventing credential exposure
- Supporting environment-based configuration
- Simplifying deployment management
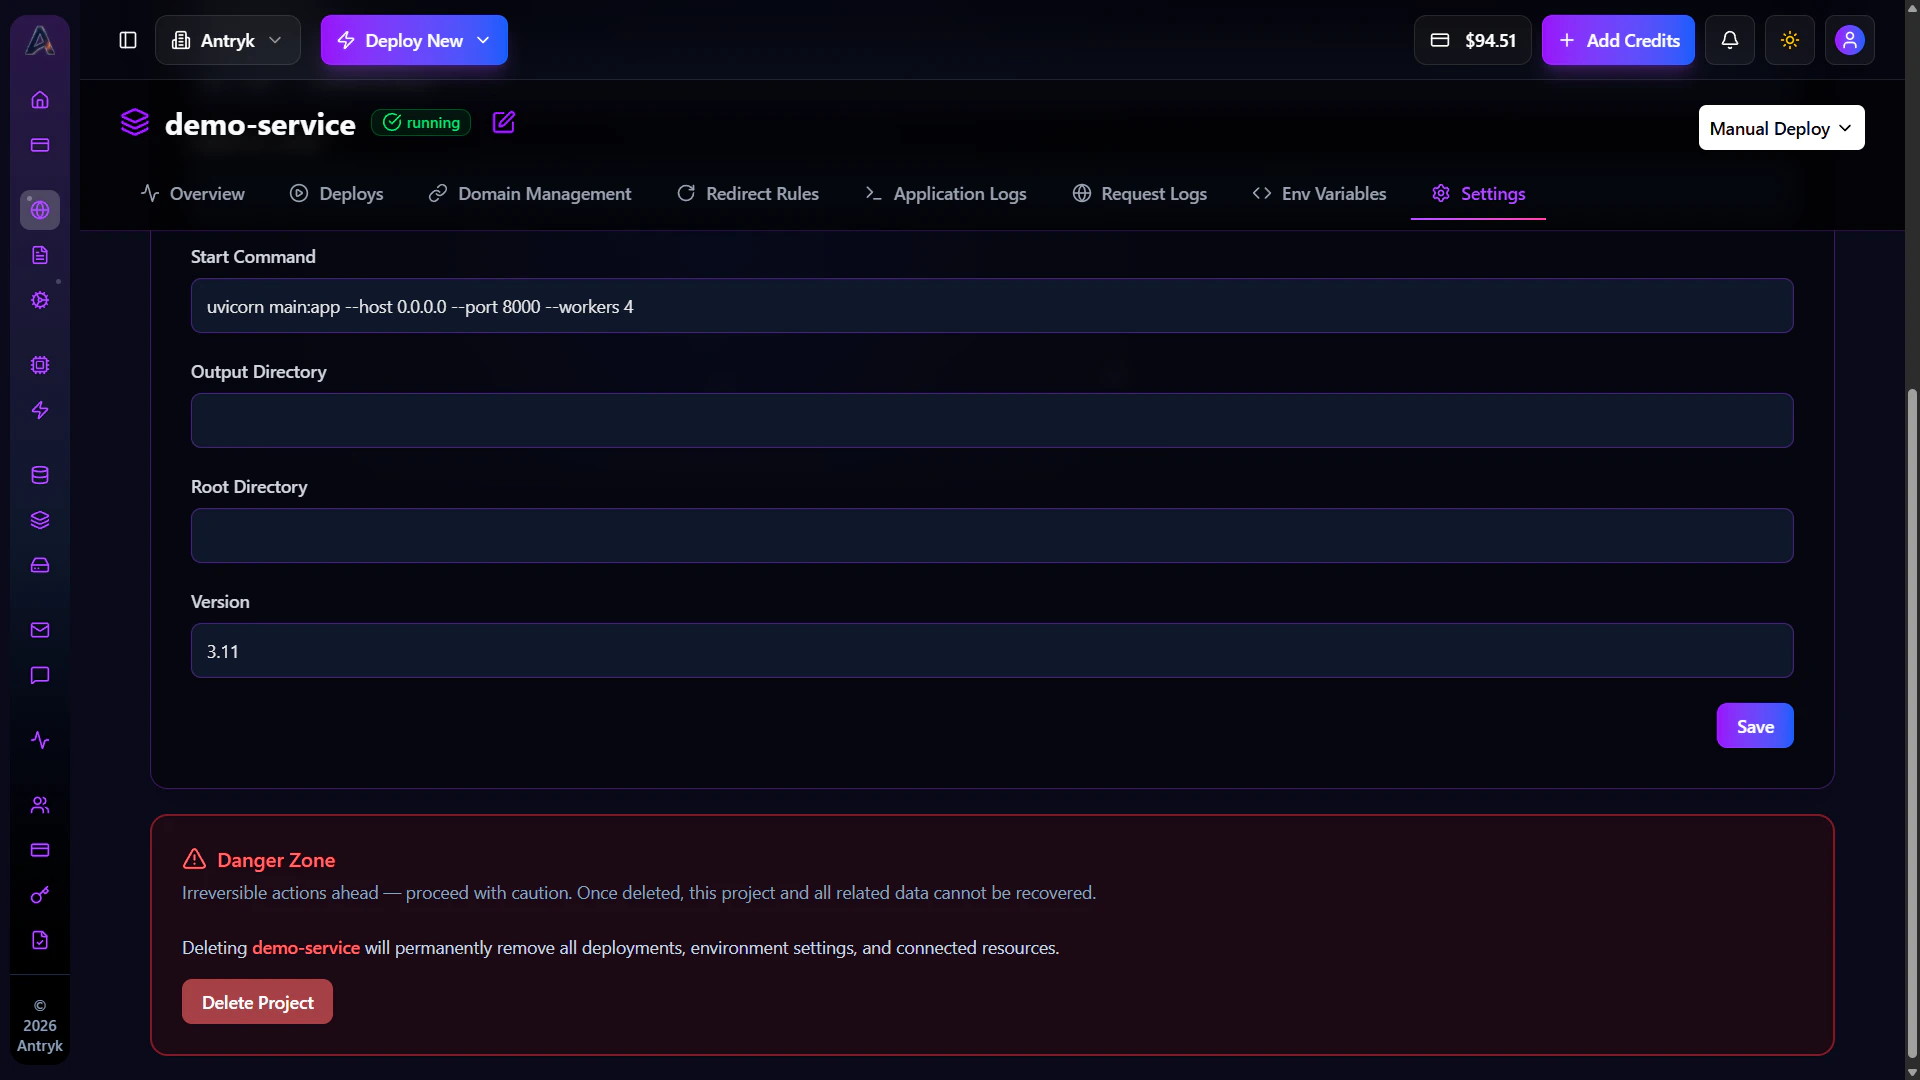
Settings
The Settings tab contains advanced configuration and lifecycle management options for your Web Service. This section allows administrators and developers to update service-level configuration or permanently delete services when no longer required.Configuration Options
- Update service name
- Modify deployment configuration
- Change runtime settings
- Update resource allocation
- Configure scaling preferences
- Manage infrastructure behavior
Administrative Actions
- Restart services
- Redeploy applications
- Pause deployments
- Delete Web Services permanently
Resource Configuration
Developers can manage:- CPU allocation
- Memory limits
- Runtime versions
- Deployment behavior
- Service scaling configuration
Operational Benefits
The Settings section helps teams:- Optimize infrastructure usage
- Manage production resources
- Update runtime environments
- Maintain operational control
- Safely manage service lifecycle
Deploy Your First Web Service
Get started with web services