

Documentation Index
Fetch the complete documentation index at: https://docs.antryk.com/llms.txt
Use this file to discover all available pages before exploring further.
Website & Infrastructure Monitoring
Monitor websites, APIs, infrastructure services, ports, and socket-based applications directly inside Antryk using the built-in Monitor Service. Antryk Monitoring helps organizations track uptime, detect downtime incidents, monitor response performance, validate HTTP status codes, and receive real-time notifications whenever services experience issues.Free Monitoring Service — Antryk Monitor Service is currently free to use
for monitoring websites, APIs, infrastructure services, and endpoints.
- Monitor website uptime
- Track API availability
- Validate HTTP status codes
- Monitor TCP/UDP socket services
- Track server response times
- Configure monitoring intervals
- Detect downtime automatically
- Receive recovery notifications
- Monitor infrastructure health in real-time
- Manage monitoring configurations centrally
What is Monitor Service?
Monitor Service is Antryk’s uptime and infrastructure monitoring system designed for websites, APIs, backend services, servers, and network-based applications. The platform continuously checks configured targets based on customizable intervals and timeout settings. Whenever a service becomes unavailable, slow, or returns unexpected responses, Antryk automatically records the event and can notify administrators through configured notifications. The monitoring platform supports:- HTTP & HTTPS monitoring
- API health checks
- Server availability checks
- Port monitoring
- Socket connection monitoring
- Status validation
- Performance monitoring
- Historical monitoring logs
Monitoring Dashboard Overview
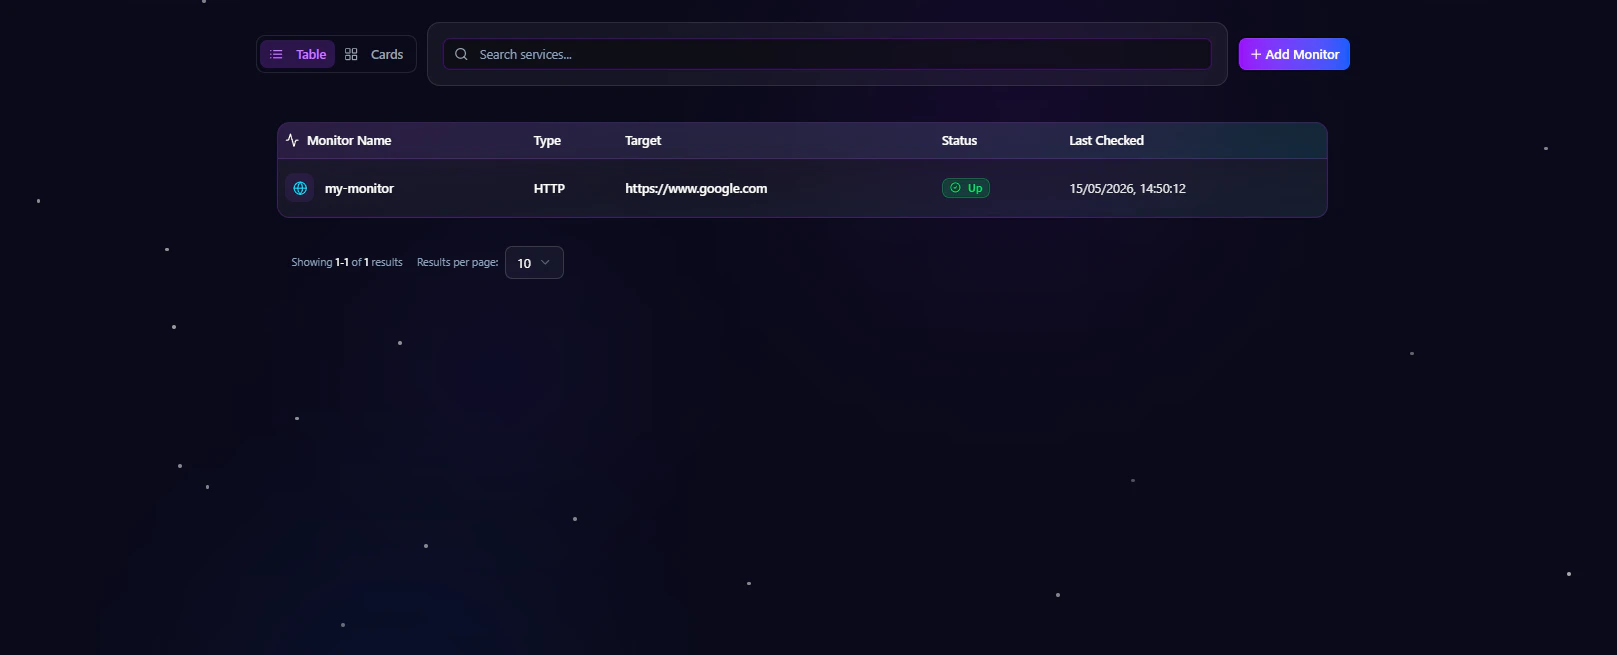
The Monitor Dashboard provides a centralized interface where users can: Users can quickly review:- Monitor name
- Current monitor status
- Target endpoint
- Monitor type
- Last check status
Features of the Monitor Listing Page
- Real-time monitor status indicators
- Active and inactive monitor tracking
- Quick access to monitor details
- Centralized monitor management
- Search and filtering support
- Infrastructure visibility across services
Monitor Detail Page
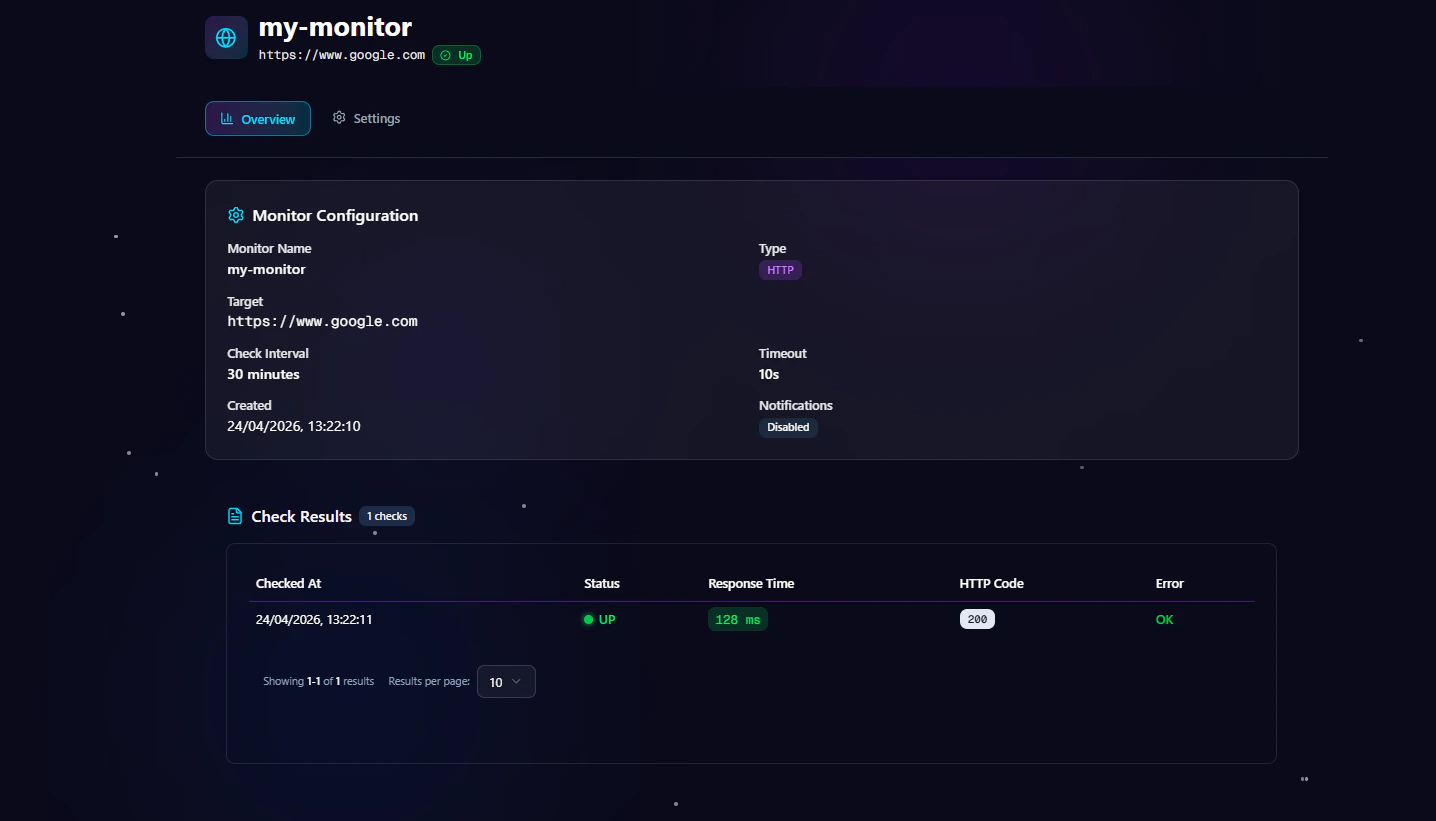
Each monitor includes a dedicated detail page for reviewing monitoring activity and configuration settings. The Monitor Detail Page contains:Overview Section
The Overview section displays:- Monitor status
- Target endpoint
- Monitor type
- Check frequency
- Response performance
- Expected status code
- Historical uptime activity
- Monitor identifiers
Settings Section
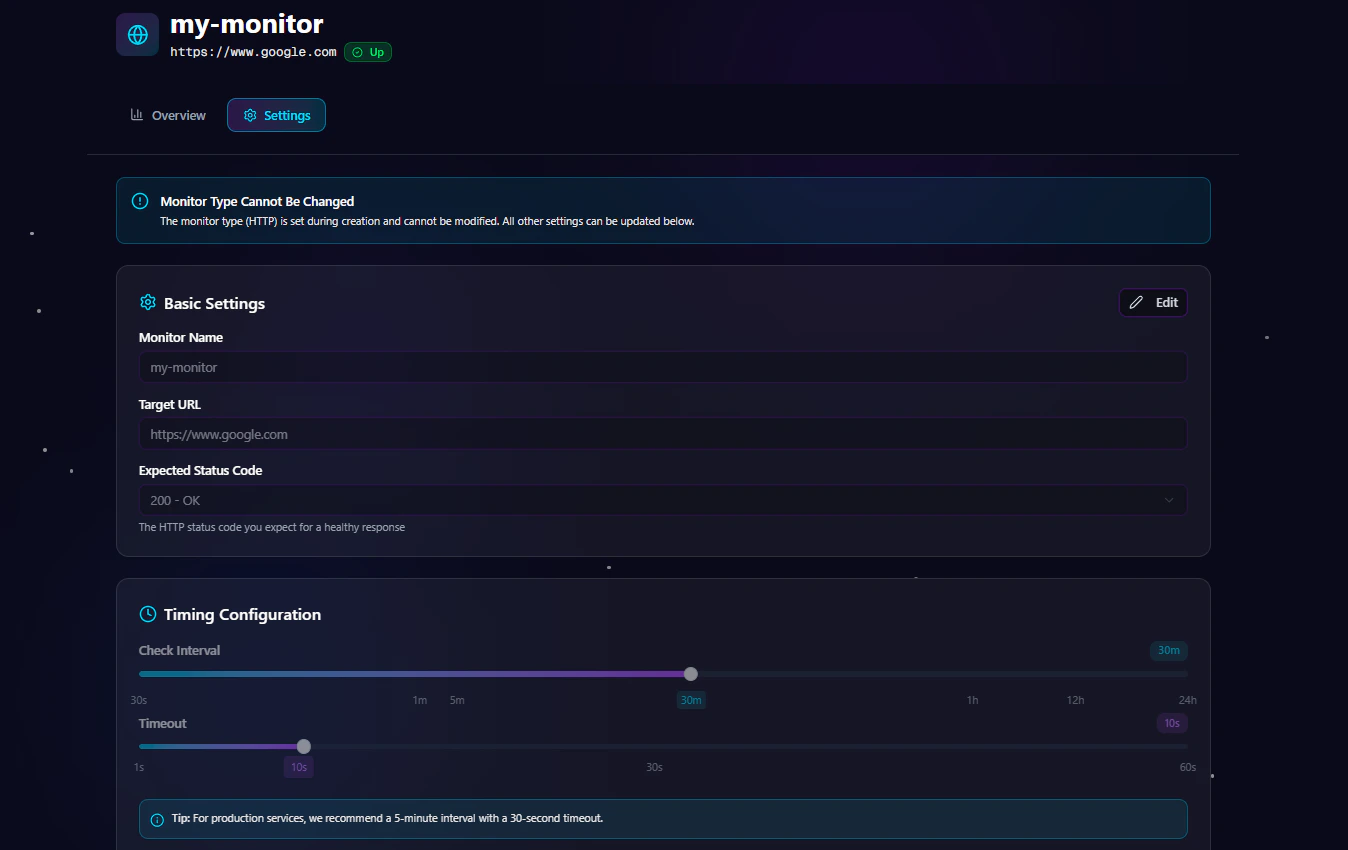
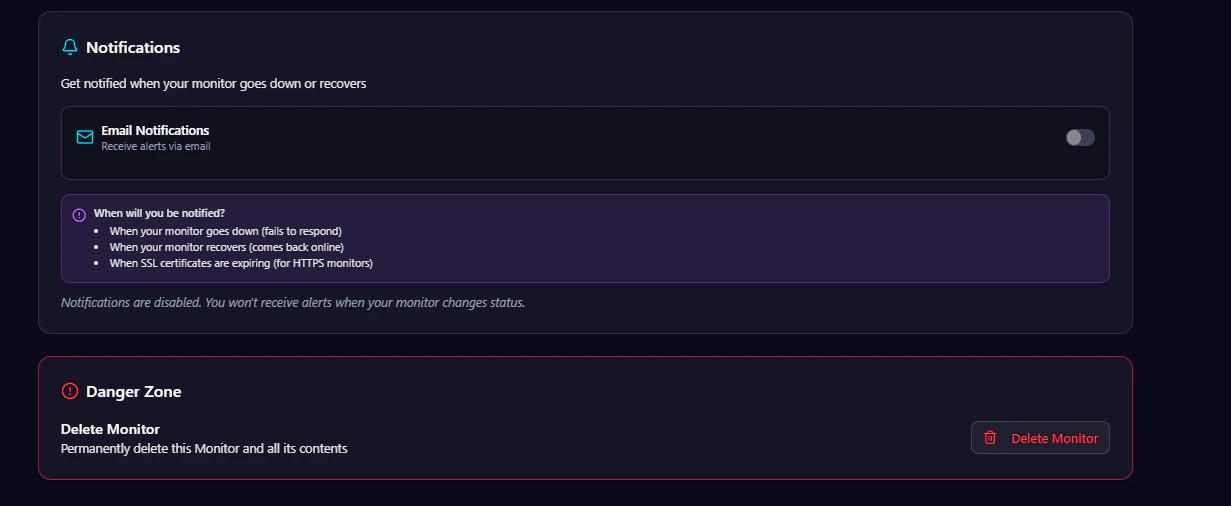
The Settings section allows users to:- Update monitor configuration
- Change monitoring intervals
- Modify timeout values
- Update notification preferences
- Edit target endpoints
- Change expected status codes
- Enable or disable monitors
Creating a New Monitor
Antryk allows users to create monitors for websites, APIs, servers, ports, and socket services directly from the monitoring dashboard. The monitor creation workflow is designed to simplify uptime monitoring and operational tracking.Create Monitor Form
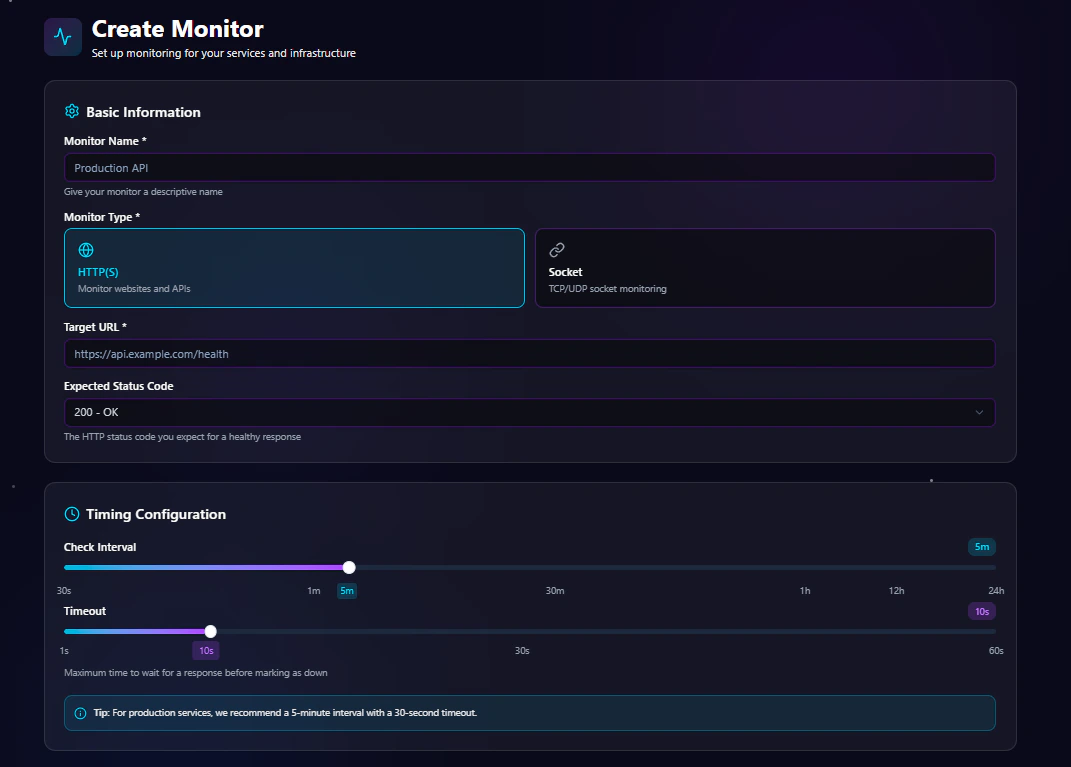
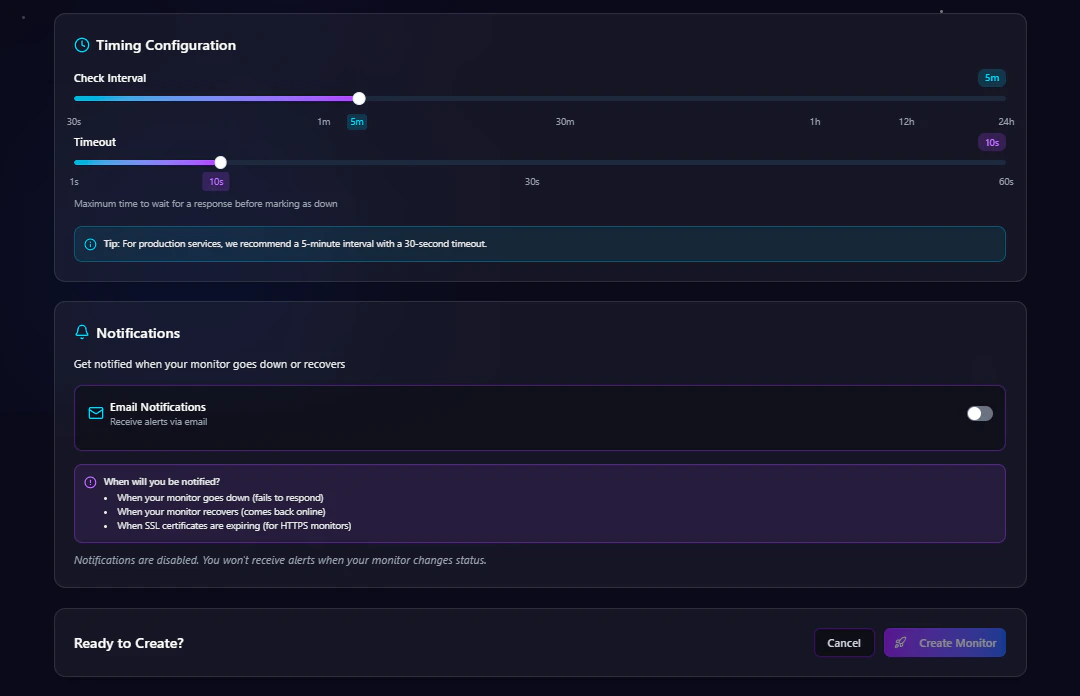
The Create Monitor form allows users to configure monitoring settings, intervals, notifications, and validation behavior. The monitor setup process includes:- Basic monitor information
- Monitor type selection
- Endpoint configuration
- Timing configuration
- Timeout settings
- Notification management
Step 1 — Basic Information
The Basic Information section defines the monitor identity and monitoring target.Monitor Name
Enter a descriptive name for the monitor. Examples:- Production API
- Main Website
- Authentication Service
- Database Port Monitor
- WebSocket Gateway
Monitor Type
Choose the type of monitoring to perform. Supported monitor types include:| Monitor Type | Description |
|---|---|
| HTTP(S) | Monitor websites and API endpoints |
| Socket | Monitor TCP/UDP socket services |
| Port | Monitor open ports and service availability |
| Ping | Monitor server/network reachability |
Target URL
Specify the target endpoint, host, or service to monitor. Examples:Expected Status Code
For HTTP monitoring, define the expected successful HTTP response code. Common examples include:| Status Code | Meaning |
|---|---|
| 200 | Successful response |
| 201 | Resource created |
| 204 | No content |
| 301/302 | Redirect response |
| 401 | Unauthorized |
| 403 | Forbidden |
| 404 | Resource not found |
| 500 | Internal server error |
| 503 | Service unavailable |
Step 2 — Timing Configuration
Timing Configuration controls how frequently Antryk checks the monitor and how long the platform waits before marking the service as unavailable.
Check Interval
The Check Interval defines how often the service is checked. Supported intervals range from:- 30 seconds
- 1 minute
- 5 minutes
- 30 minutes
- 1 hour
- 12 hours
- 24 hours
Recommended Monitoring Intervals
| Use Case | Recommended Interval |
|---|---|
| Critical production APIs | 30s – 1m |
| Public websites | 5m |
| Internal services | 5m – 15m |
| Non-critical infrastructure | 30m – 1h |
For production environments, Antryk recommends a 5-minute monitoring interval
with a 30-second timeout configuration.
Step 3 — Timeout Configuration
Timeout defines the maximum amount of time Antryk waits for a service response before considering the check failed. Supported timeout range:- Minimum: 1 second
- Maximum: 60 seconds
Recommended Timeout Values
| Service Type | Recommended Timeout |
|---|---|
| Static websites | 5s |
| Standard APIs | 10s |
| Heavy backend services | 30s |
| Long-running operations | 60s |
Step 4 — Notifications
Notifications help teams respond quickly when monitored services experience downtime or recovery events. The notification system supports:- Downtime alerts
- Recovery notifications
- Status change notifications
- SSL expiration notifications (HTTPS monitors)
Email Notifications
Enable Email Notifications to receive automated alerts whenever monitor status changes occur. Notifications are triggered when:- A service becomes unavailable
- A monitor recovers successfully
- Status validation fails
- Timeout limits are exceeded
Deploying the Monitor
After configuring all monitor settings:- Review the monitor configuration
- Verify the target endpoint
- Validate timing settings
- Enable notifications if needed
- Click Create Monitor
Supported Monitor Types
Antryk currently supports multiple infrastructure monitoring methods.HTTP(S) Monitoring
HTTP monitoring validates website and API availability using HTTP and HTTPS requests.Supported Use Cases
- Website uptime monitoring
- API health checks
- REST API validation
- Webhook monitoring
- SSL endpoint tracking
Socket Monitoring
Socket monitoring validates TCP and UDP socket connectivity.Supported Use Cases
- Custom socket applications
- Real-time services
- TCP connection validation
- UDP infrastructure monitoring
Port Monitoring
Port monitoring checks whether infrastructure ports are accessible and accepting connections.Supported Use Cases
- Database availability
- Internal service ports
- Infrastructure validation
- Service connectivity checks
Ping Monitoring
Ping monitoring validates server reachability using ICMP requests.Supported Use Cases
- Server uptime
- Network health
- Host availability
- Infrastructure reachability
Monitor Results & Historical Logs
Each monitor stores historical monitoring results for operational visibility and troubleshooting. Historical logs include:- Check timestamp
- Monitor status
- Response duration
- Status code
- Error details
- Failure messages
Notification Events
Antryk Monitoring supports automated alerting for operational incidents.Downtime Detection
Notifications are sent immediately when a monitor check fails. The notification includes:- Monitor name
- Target endpoint
- Failure timestamp
- Error details
- Response information
Recovery Notifications
Recovery alerts are automatically sent when a service comes back online after downtime. This helps teams confirm issue resolution and service restoration.Best Practices for Monitoring
Use Short Intervals for Critical Services
Production APIs and public-facing services should use lower check intervals for faster incident detection.Configure Realistic Timeouts
Avoid aggressive timeout values that may generate false downtime alerts during temporary latency spikes.Use Separate Monitors
Create dedicated monitors for:- APIs
- Frontend websites
- Databases
- Authentication services
- Infrastructure gateways
Enable Notifications
Always enable notifications for production-critical infrastructure to reduce response time during outages.Common Monitoring Use Cases
Website Monitoring
Track public website availability and uptime performance.API Health Monitoring
Validate backend API health endpoints continuously.Database Port Monitoring
Validate database connectivity and infrastructure availability.Socket Service Monitoring
Monitor custom TCP or UDP socket services.Troubleshooting
Monitor Shows DOWN but Service is Online
Possible causes:- Incorrect expected status code
- Firewall restrictions
- Network latency
- Timeout values too low
- Invalid endpoint configuration
Notifications Not Received
Verify:- Email notifications are enabled
- Email addresses are correct
- Spam folders are checked
- Monitor status is active
High Response Times
Recommended actions:- Optimize backend performance
- Review database queries
- Implement caching
- Use CDN infrastructure
- Increase timeout configuration if necessary
Pricing
Antryk Monitor Service is currently provided free of charge.
- Monitor count restrictions
- Historical data retention limits
- Email-only notification support
Monitor Service Overview
Antryk Monitoring provides centralized uptime monitoring, infrastructure visibility, API validation, response tracking, and operational alerting for modern applications and services. Using the monitoring dashboard, teams can:- Track service uptime
- Detect downtime incidents
- Monitor infrastructure health
- Validate API responses
- Review historical logs
- Configure operational alerts
- Manage infrastructure monitoring centrally
Create Your First Monitor
Start monitoring websites, APIs, infrastructure services, and endpoints inside Antryk